How Not to Measure Computer System Performance
17 November 2014
In a recent Sampa group meeting, I spoke about the many pitfalls in measuring computer system performance.
Everyone knows computer science is not a real science. As my officemate put it to me, you know it’s a fake science if they had to put science in the name. But what did we do to deserve such a bad scientific reputation? One thing that the fields dear to my heart (architecture and programming languages) do poorly is quantifying their results. In the real sciences, researchers slave over experimental designs and quantitative methods, because experiments are often vast and expensive to run. In contrast, our field is the wild west.
This is doubly concerning when you realise that, compared to other sciences, computer science experiments tend to be among the most non-deterministic and prone to omitted-variable bias. Computer systems have many moving parts in both hardware and software, researchers are unlikely to have a complete understanding of every part in those systems, and controlling each of those components is often next to impossible.
Omitted-variable bias
Environmental bias
Mytkowicz et al showed a variety of environmental factors that significantly bias the results of compiler experiments. If you do any kind of computer systems research, this paper should be absolutely terrifying to you. Their first result shows that linking order can significantly bias the results of a benchmark (here, perlbench from SPECcpu2006):
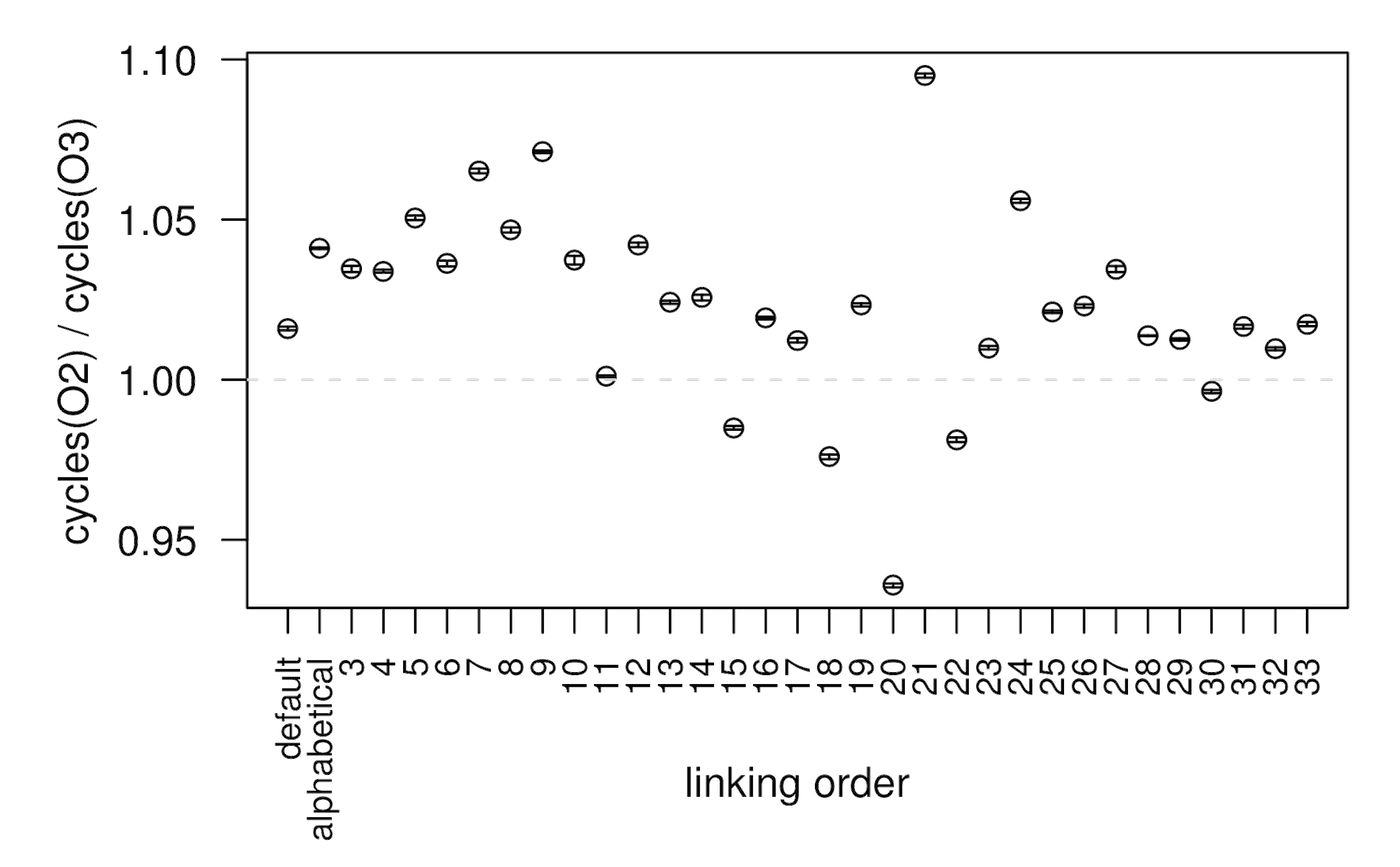
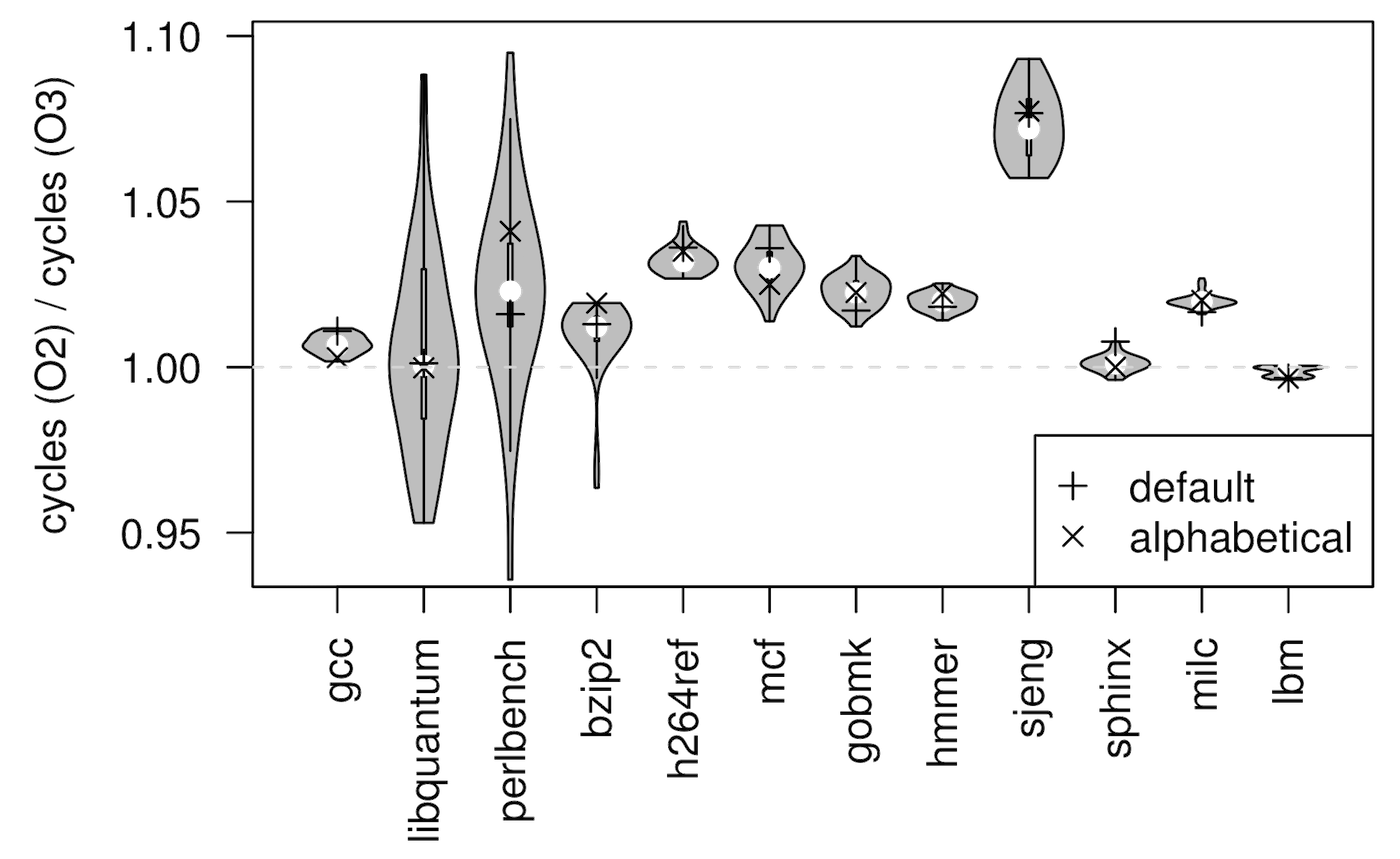
Here on the x-axis are two fixed linking orders (the SPECcpu default and an alphabetical order) and 31 random orders. The performance variation is 15% and, most worryingly, straddles 1.0 – so picking the wrong linking order can tell you your compiler is worse when it’s actually better! This effect is not unique to one benchmark; here are the results over a variety of SPECcpu2006 programs:
I never really pay attention to the order I put things in my Makefiles, as long as everything compiles, but these results might make me start paying attention.
Even more terrifying than linking order is a result in this paper that shows how the size of your UNIX environment variables biases performance. Here’s perlbench again, with different environment sizes on the x-axis:
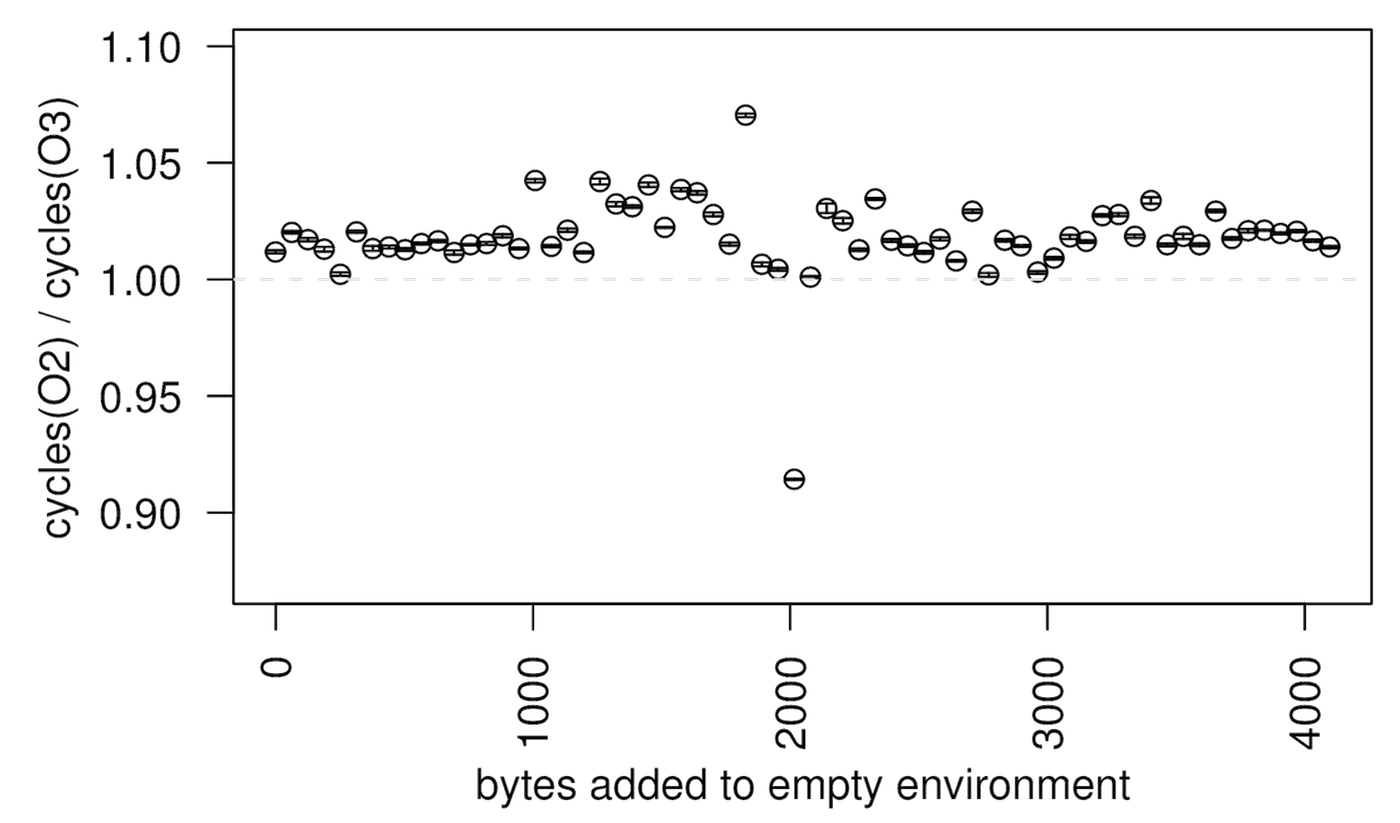
The scary part here is that even innocuous things like changing your username can change the size of your UNIX environment. If I run an experiment on a machine logged in as james, then my advisor runs the same experiment with the same binaries on the same machine logged in as thagrossmanator9000, there’s every risk of running afoul of this source of bias.
What should we do about these sources of bias? It’s probably not practical to expect researchers to randomise or control all these omitted variables, not least because it’s hard to control what you don’t know. Some cool work from UMass randomises code, stack, and heap layouts at runtime to try to control for some of these biases, but it’s hard (impossible?) to know whether we caught every possible source of bias.
Uncontrolled variables
I think there’s an important distinction between variables we don’t immediately expect to cause bias (like linking order or environment size) and variables we would expect to cause bias but just don’t control well.
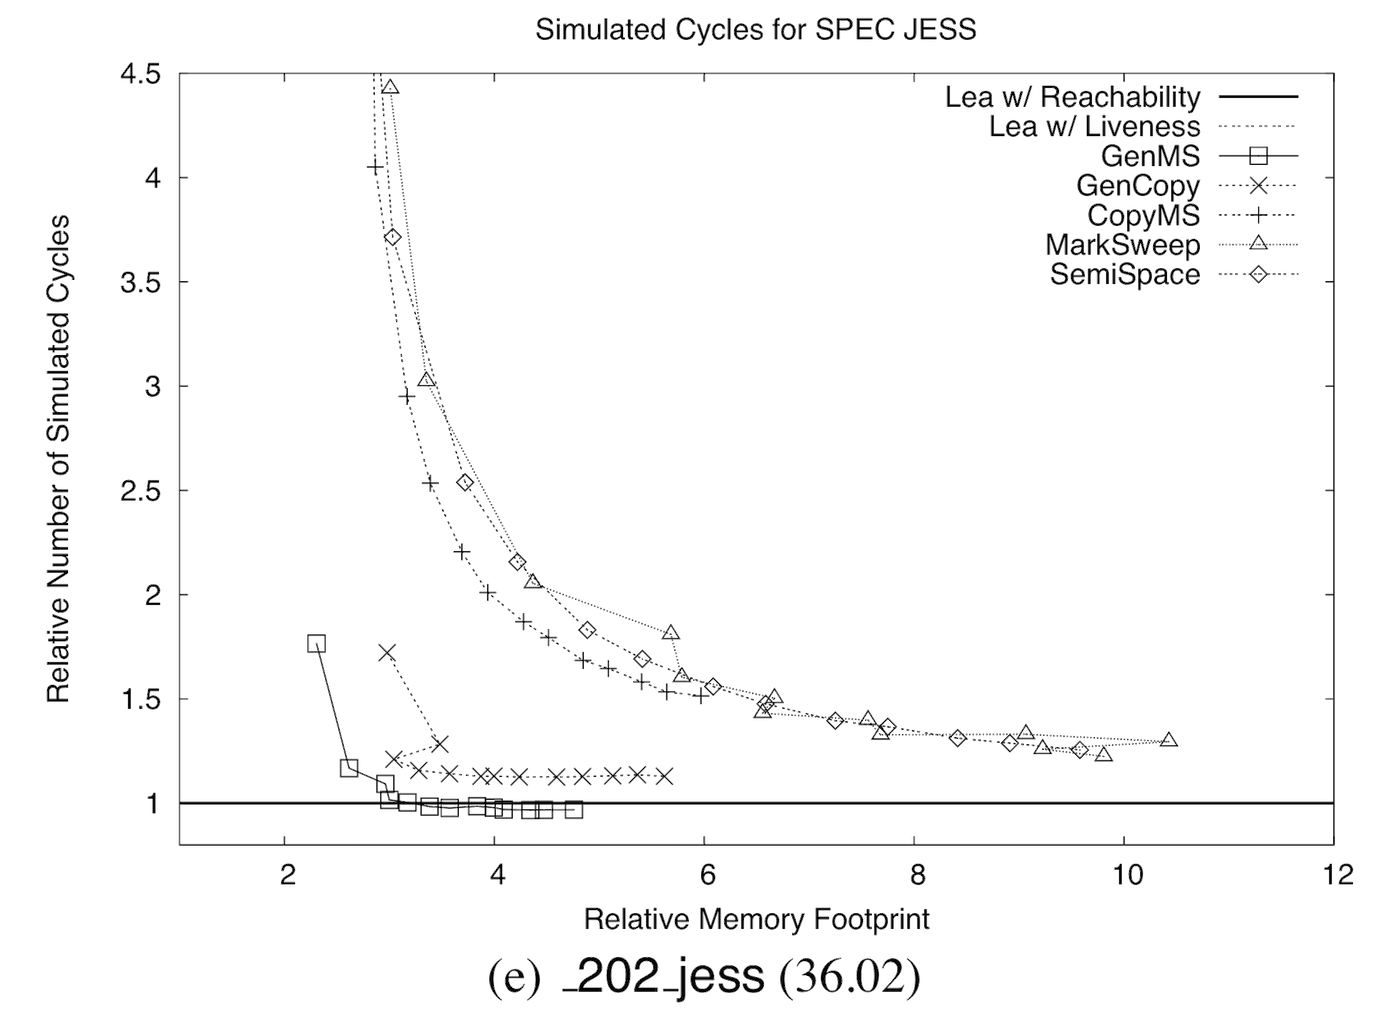
In the garbage collection world, heap size was one of these variables for a very long time. Researchers often ran their garbage collector comparisons at a single heap size, ignoring the time-space trade-off that garbage collection explores. Only in the last decade or so have garbage collection papers started showing graphs like this one, from Wake Up and Smell the Coffee: Evaluation Methodology for the 21st Century (an excellent paper you should certainly read):
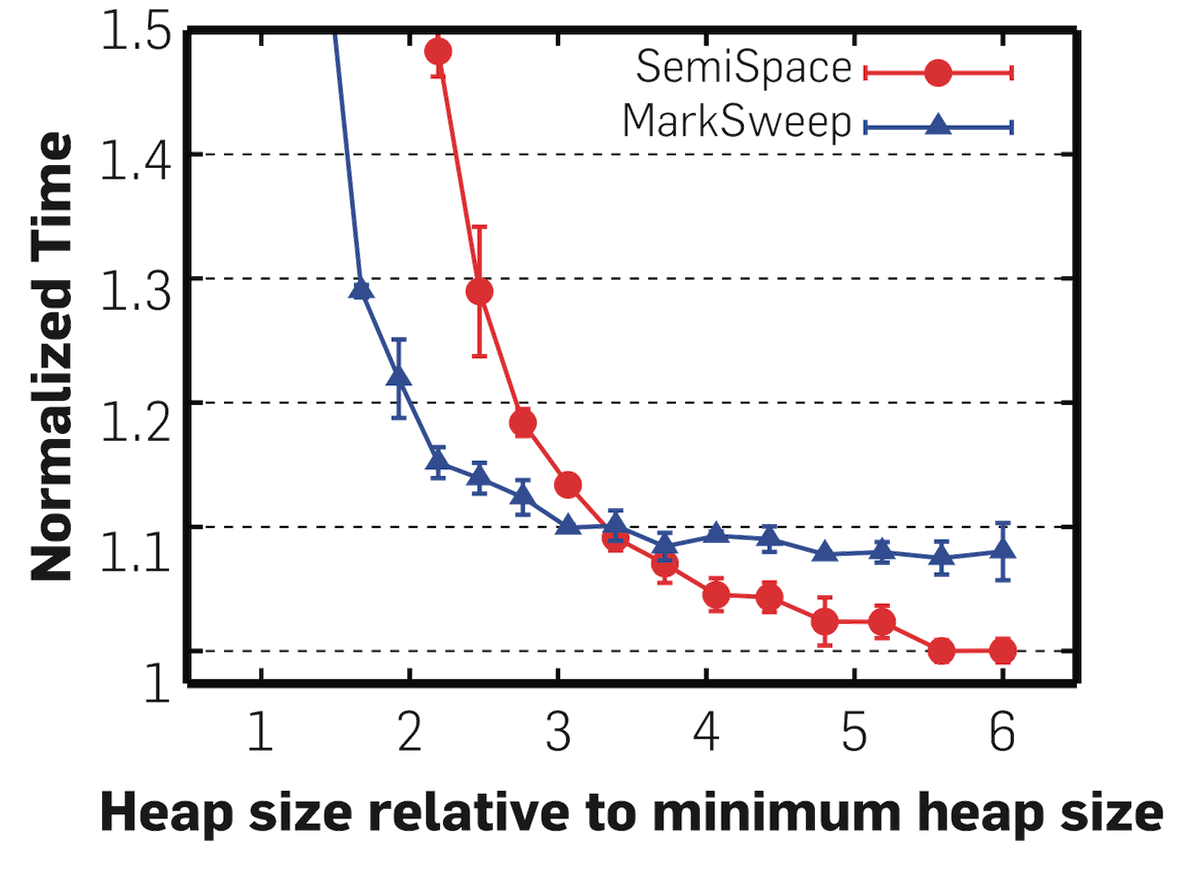
This graph shows that we could have gamed our results to show either mark-sweep or semi-space as the “best” garbage collector by being judicious in our choice of heap sizes. (Of course, it turns out both collectors are pretty bad, but that’s another story.)
Charts like this one are very dangerous if you’re not careful about what they actually say. If you’re one of the six people in the world who care about garbage collection, you might have read Drew Crawford’s Why mobile web apps are slow, which uses a graph from a fantastic paper by Matthew Hertz and Emery Berger to claim that garbage collection couldn’t possibly work:
Crawford cherry-picks this single-benchmark graph from the paper because it shows particularly poor performance for some relatively naive collectors like naive mark-sweep. But he uses the poor performance of naive mark-sweep on this single benchmark to confidently declare that all garbage collection is a disaster and we should just give up. (Vitaly Mikheev compares this conclusion to using bubble sort to argue that sorting is slow.) The reality of Hertz and Berger’s detailed study is far more subtle. For one, this particular benchmark is an extreme outlier compared to most of the others in the paper. Also, even in this very graph, more modern collectors like generational mark-sweep have acceptable performance except in the most extreme conditions. But the allure of the exponential graph was simply too much for Crawford, and cherry-picking too easy. As always, it’s easy to lie with statistics and graphs. [update: an older version of this paragraph could have been interpreted as saying that Hertz and Berger were being deliberately misleading, which is not at all what I meant. Sorry about that.]
Compiler bugs
When it comes to benchmarking, we’re usually happy to trust the compiler. For example, we routinely assume that compiling a system twice should yield two binaries with the same performance characteristics, even if we don’t have deterministic builds to guarantee that the binaries are byte-for-byte equivalent. Unfortunately, our trust is often misplaced.
In 2012, I was working on some experiments with Jikes RVM, a Java virtual machine. At one point, I thought it would be clever to build the VM ten times and run performance experiments on all ten binaries. Here are the results from those ten binaries on the _228_jack benchmark from SPECjvm98:
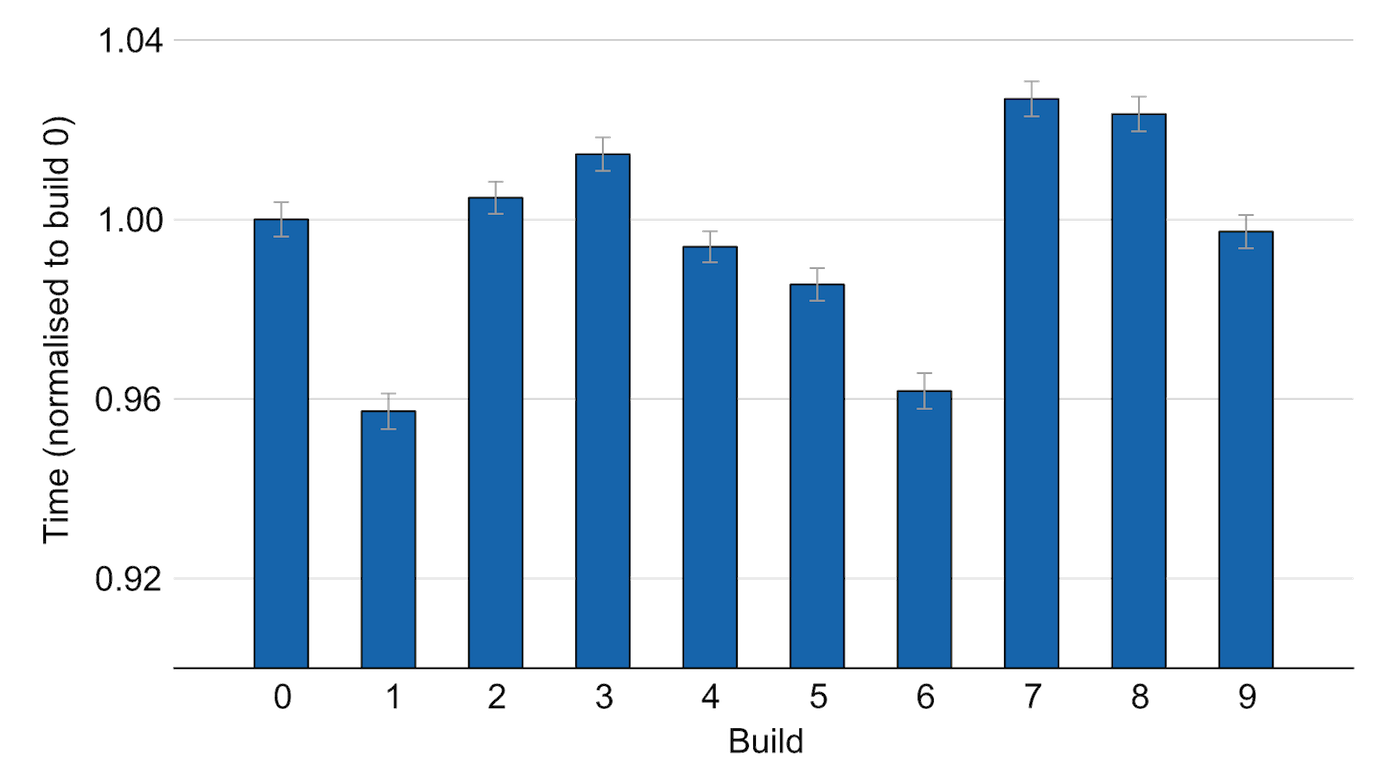
These supposedly identical builds vary in performance by up to 7%! If you’ve ever compiled an old system and a new system to compare the two, and the quantum of the difference was in this range, results like this mean you can’t really be sure whether you saw a true difference or a build artefact.
This particular result turned out to be a bug in Jikes RVM’s implementation of Pettis-Hansen code reordering, an old technique for profile-guided optimisation of code layout at the basic block level. I fixed the bug, but it lurked in Jikes for over ten years before we noticed it.
Bad benchmarks
The performance evaluation world is also plagued by bad benchmarks. You might have noticed that every browser vendor now has their own JavaScript benchmark suite, and claims that theirs is the most neutral, and that it’s just a coincidence that their browser wins on their benchmark suite. The reality is that benchmarks are tragically easy to game.
Cliff Click gave a fantastic presentation about the art of Java benchmarking in 2009, and highlighted just how many benchmark suites are completely bogus. In the research community, benchmark suites are in a sorry state. For managed languages, most researchers still run SPECjvm98 as part of their analysis. SPECjvm98 is now 16 years old, and was released only three years after Java was, so it’s hard to argue that those benchmarks bear any relevance to modern Java or modern computer systems. Likewise, many computer architecture researchers are still wedded to SPECcpu2000, which is now 14 years old. Again, it’s hard to argue that these benchmarks are still relevant to today’s problems.
Even if you choose a good benchmark suite, it’s often tempting to drop outliers or benchmarks that don’t run the right way. For example, a recent HPCA paper used SPECcpu2006 benchmarks to compare performance and efficiency of ARM and x86 ISAs. They had trouble running some benchmarks, so only ran “10 of 17 [floating-point] benchmarks”. But then they found that some of those 10 were outliers, and dropped them from the results, leaving only 5 of the original 17 floating-point benchmarks.
The problem with subsetting benchmarks in this way is that you ignore important behaviour. Benchmark suites are supposed to reflect the space of possible programs, and by subsetting the set of benchmarks, you (unwittingly) bias your results towards certain regions of that space. To make this argument concrete, Perez et al found that when comparing different cache optimisations, subsetting the benchmarks could create many different “best” optimisations, depending on which benchmarks are included:
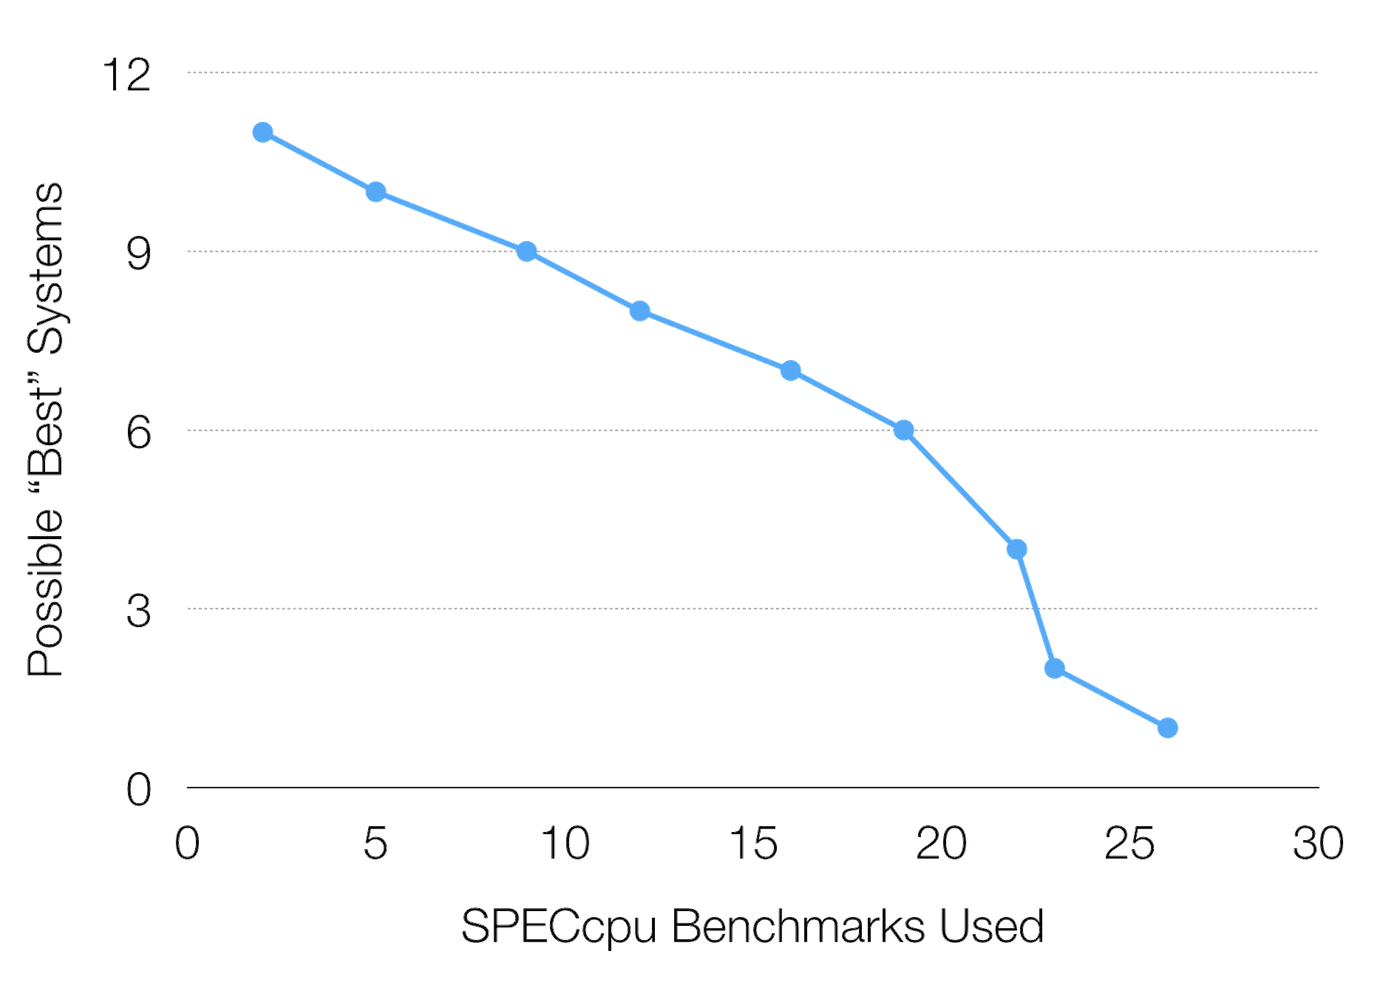
This graph says that even if we drop just a few benchmarks from the 26 in the suite, we can create two or more possible “best” systems. If we go so far as to drop 12 benchmarks, as the HPCA paper does, there are 7 possible “best” systems out of 12 being tested. This is not to suggest that the authors gamed their results in any way. Rather, the point is that dropping benchmarks from your comparison creates bias.
We should also be careful when creating new benchmarks. For example, the same HPCA paper uses the lighttpd web server as a server benchmark. But the benchmark completes in just 47 milliseconds on a modern desktop CPU. This means the benchmark is likely only measuring the start-up and tear-down time of the web server, rather than the actual work whose performance we care about. I doubt there are many production users of lighttpd who are restarting their web server 20 times per second.
Conclusions
What should we take from all these results, apart from a deep feeling of sadness and despair for computer “science”? I think part of the problem is that we are chronically afraid of running “big” experiments, because the tools we use aren’t equipped to do so efficiently. Most researchers I’ve met tend to rebuild their infrastructure over and over again, writing new scripts to parse, tabulate and plot their results for every experiment. This approach clearly doesn’t scale.
We should be investing more heavily in infrastructure to support our computer systems research. We’re lucky to get funding to build hardware infrastructure for our work, but that doesn’t seem to extend to building software to actually use this infrastructure effectively. Part of my undergraduate research was to build plotty, a web application that managed the output of most of our group’s experiments, ingesting raw output from benchmarks and outputting (arguably nice-looking) graphs and tables:
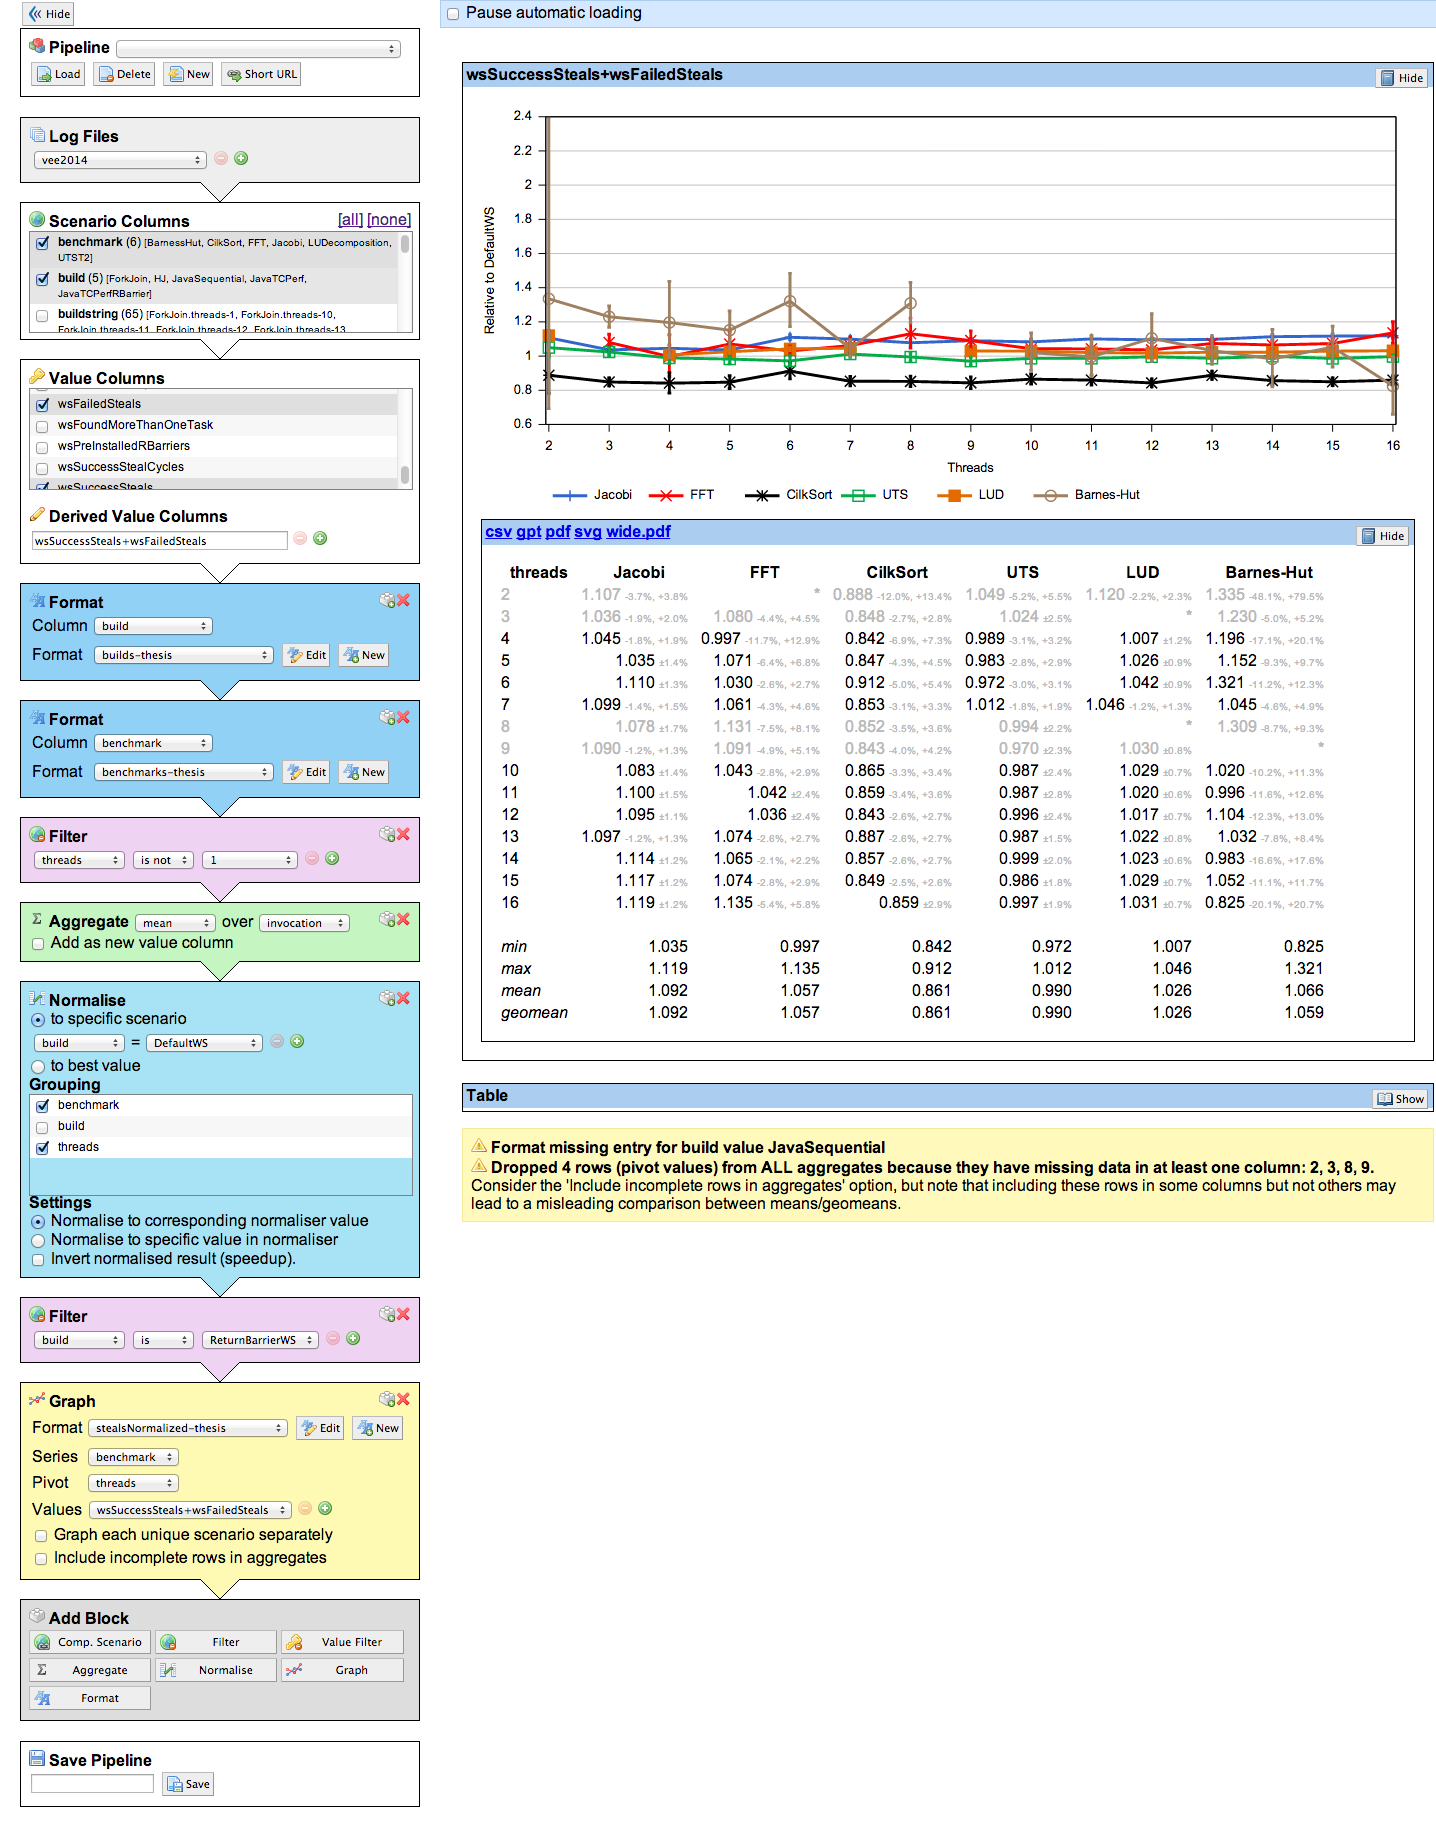
Plotty saves us from having to reimplement common analyses over and over again, and protects us from the bugs that crop up when doing so (can you remember, off the top of your head, how to use scipy’s t distribution for a hypothesis test?). It works well for our small group, and helps us collaborate. I think infrastructure like this is increasingly important.
Measuring modern computer systems requires clever and thoughtful experiment design, careful execution, and delicate, large-scale analysis. But remember that measurement is ultimately just a way of quantifying the real problem: are our systems improving? The sooner we accept that measurement is getting harder, and that our existing strategies aren’t good enough, the sooner we can start convincingly solving the real problems.