Symbolic Profiling for Scalable Verification and Synthesis
17 October 2018
Our OOPSLA’18 paper introduces performance debugging techniques for automated reasoning tools.
Automated reasoning tools—verifiers that check program correctness, synthesizers that generate correct programs, etc.—provide incredibly powerful ways to construct safe and reliable software. We’ve shown how to use verification to build crash-safe file systems and synthesis to generate accurate machine models, among other applications. But the most powerful automated tool is one that you build for the specific problem you’re trying to solve. While I’ve shown before how to build your own synthesis tool, building a tool that’s fast enough for real problems still requires significant expertise and investment. If we want to give people the ability to build their own practical verifiers and synthesizers, we need these tools to be understandable.
Our new OOPSLA’18 paper, Finding Code That Explodes Under Symbolic Evaluation, is our approach to making automated reasoning tools explain their behavior. We’ve developed a new symbolic profiling technique that can help debug the performance of verifiers and synthesizers. We’ve used our symbolic profiler to find bugs in several real-world tools; repairing these bugs yielded orders-of-magnitude performance gains (up to 300×!). The symbolic profiler is already integrated into Rosette, so it’s available for use right now. It’s also just really satisfying to watch:
Symbolic evaluation
What makes automated reasoning tools difficult to build? I think the key problem is that these tools have an unusual execution model in which they evaluate all paths through a program—a verification tool is searching for a path that makes the program fail, while a synthesis tool is searching for a program that succeeds on every path.
This all-paths execution style gives automated reasoning tools
unintuitive performance characteristics.
As an example,
consider this simple Rosette program,
which takes as input a list of numbers lst and a number k
and returns the first k even numbers in lst:1
(define (first-k-even lst k)
  (define xs (filter even? lst))
  (take xs k))
When the inputs are known,
the way this program executes is simple enough:
first, it executes the filter procedure
by querying whether each element of lst is even,
and then it takes a prefix of the result.
Now suppose we want to verify first-k-even,
proving that it works for any input list lst and size k.
To do so, we’ll need to execute the function
on unknown (arbitrary) inputs—for example,
lst may contain unknown numbers,
and the prefix size k may itself be unknown.
When the inputs are unknown,
we have to resort to symbolic evaluation
to understand the procedure’s possible outputs.
Symbolic evaluation executes all possible paths through a program.
In the case of first-k-even,
the different paths start when we execute the filter procedure.
For example,
suppose that lst is a list of two unknown integers x0 and x1.
We don’t know whether x0 and x1 are even,
so to execute filter we have to fork into four different paths:

Here, the four paths result in four different return values for filter,
depending on the assumptions we make about whether x0 and x1 are even.
Only once we’ve evaluated all four of these paths can we run the take
part of our procedure.
But we have to run take on each of the states generated by filter—in
this example, on all four paths.
Worse still,
because k is also unknown,
we have to do more forking when evaluating (take xs k).
For example, starting from the rightmost path of filter,
we get three new paths depending on the value of k:
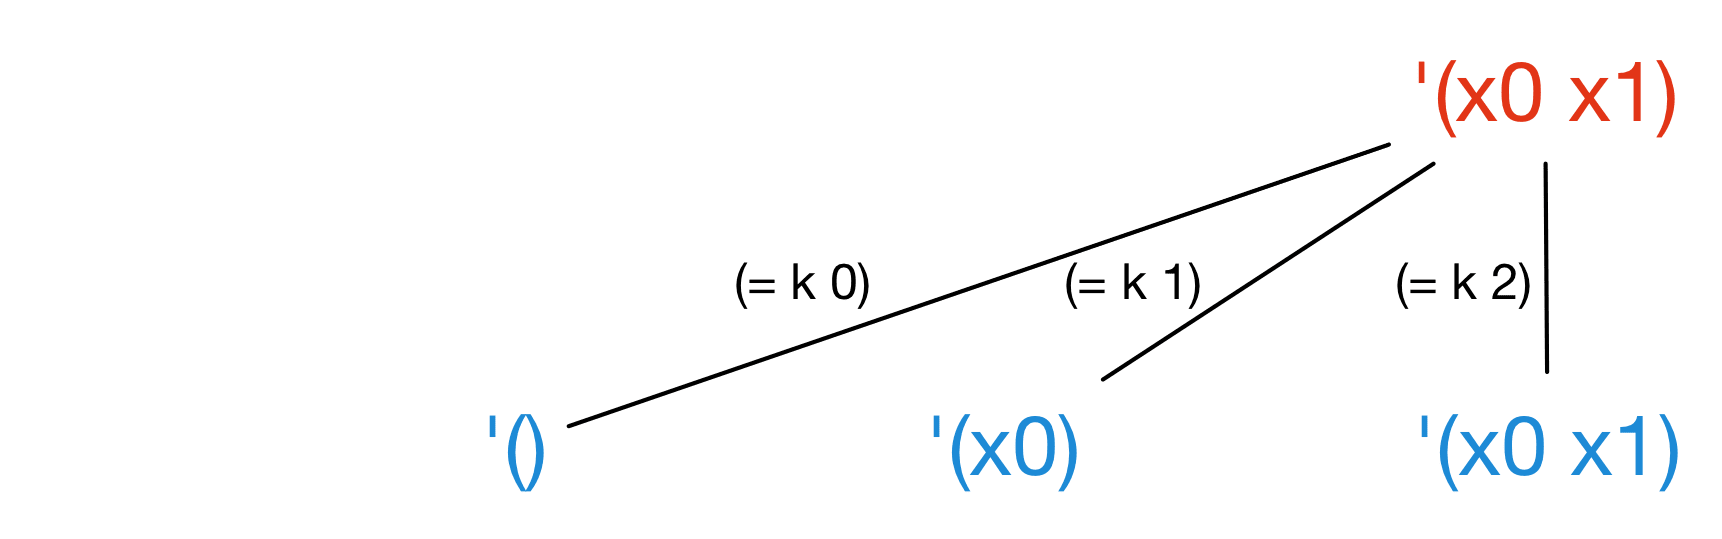
The net result is that when executing first-k-even
with a list of two unknown numbers lst
and an unknown size k,
we get eight distinct paths through the program.
This number of paths grows exponentially with the length of lst!
Optimizing symbolic evaluation
To control exponential blowup,
most symbolic evaluators adopt smarter strategies
that require less forking.
For example,
when we executed filter above,
we ended up with two final states '(x0) and '(x1)
that look quite similar—they are both lists of length one,
and differ only in the value of the first element of the list.
Rosette merges these two paths
together to reduce exponential blowup:
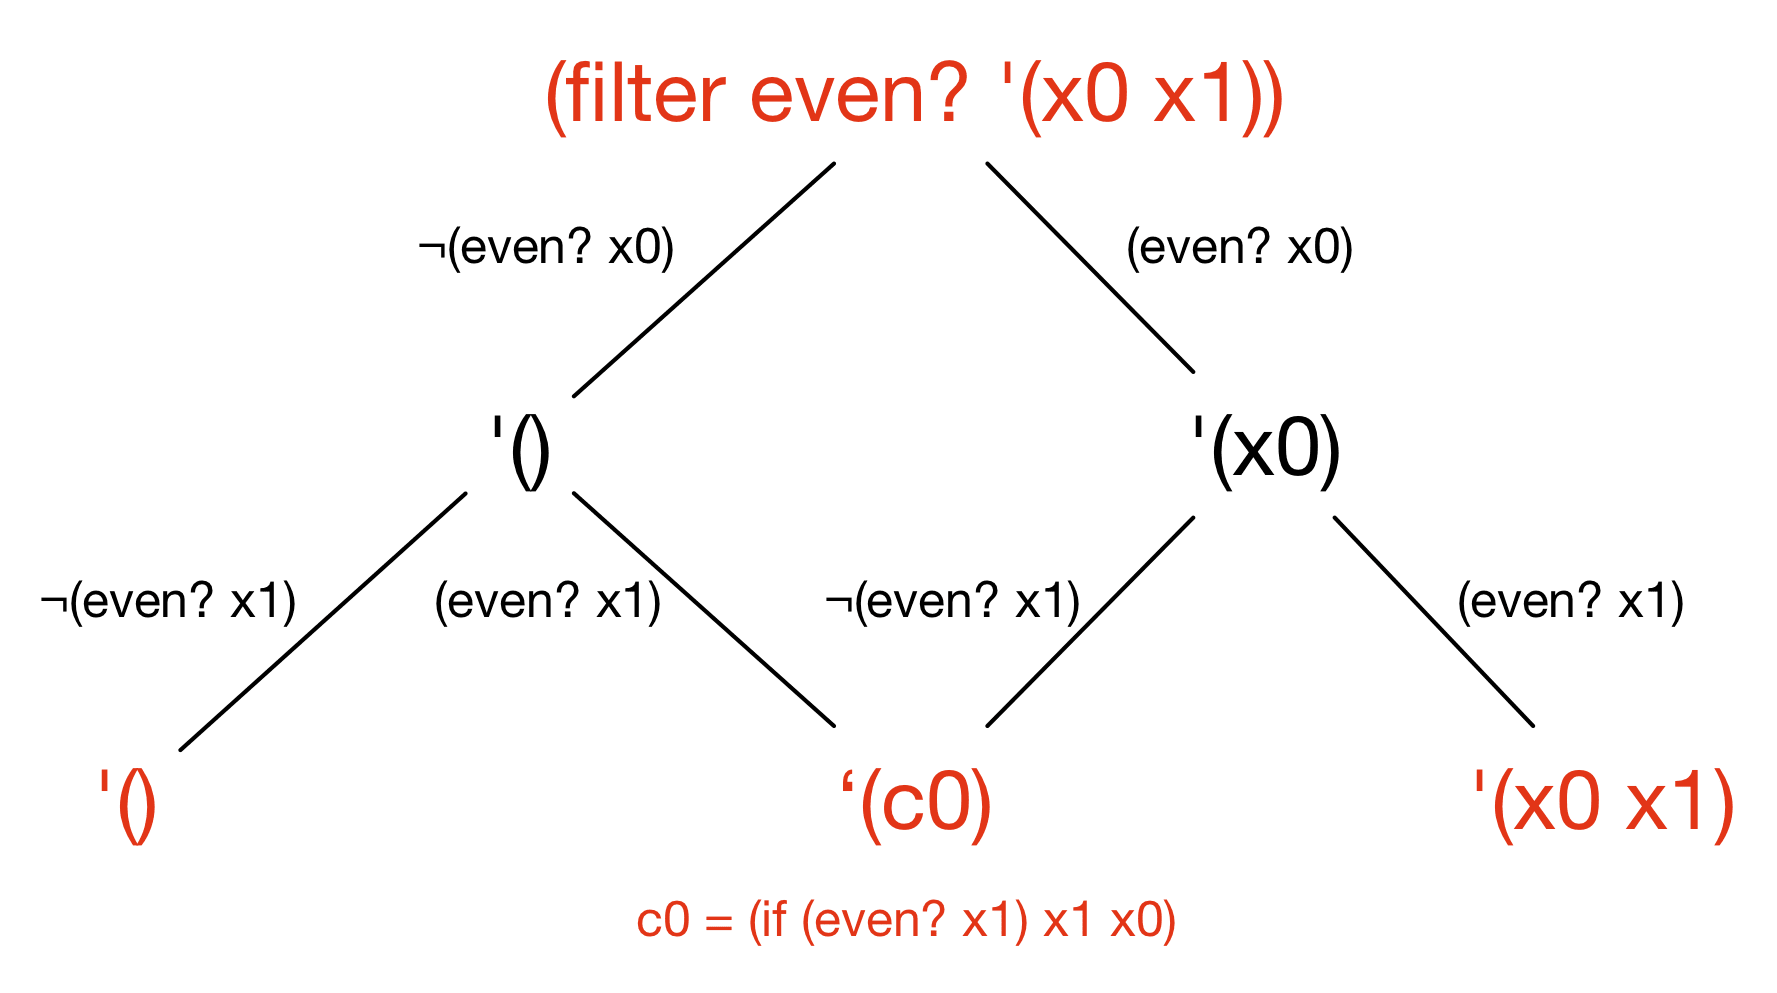
Here, the middle path introduces a new auxiliary variable c0,
whose value can be either x0 or x1 depending
on which of the two merged paths is chosen.
While merging paths mitigates exponential blowup,
it also has a downside:
the resulting states are more complex and difficult to reason about.
Diagnosing symbolic evaluation bottlenecks
Understanding the exponential blowup behavior of symbolic evaluation
is the key to building efficient automated reasoning tools.
For example,
if first-k-even were the critical bottleneck in our program,
how should we make it more efficient?
Standard performance engineering techniques
will lead us astray here,
because they do not account for all-paths execution.
In first-k-even,
a regular profiler tells us that take is the slowest part
of the procedure (it takes the most time to execute).
But take is only slow because it has to run four times,
on the four paths generated by filter.
The correct fix to first-k-even is to
control the exponential blowup of filter.
The best automated reasoning tools
carefully control their behavior by
regulating the evolution of the graphs we saw above,
which we call symbolic evaluation graphs.
Good tools choose when to merge and when to fork
based on domain knowledge about the problems
they will be applied to.
In the first-k-even example,
it might make sense to fork when lst is expected to be small
(and so gain the benefit of simpler states),
but not when it is larger.
But how should a programmer decide when to apply this careful control?
Symbolic profiling addresses this challenge
by analyzing the symbolic evaluation graph explicitly.
It summarizes symbolic evaluation using new analyses and metrics
to highlight regions of the program
that may benefit from a different evaluation strategy.
The result is profiling output
that understands the all-paths execution model.
For first-k-even,
this understanding allows our symbolic profiler
to correctly identify the true bottleneck filter,
ranking it higher than take even though take
is four times slower than filter to execute:
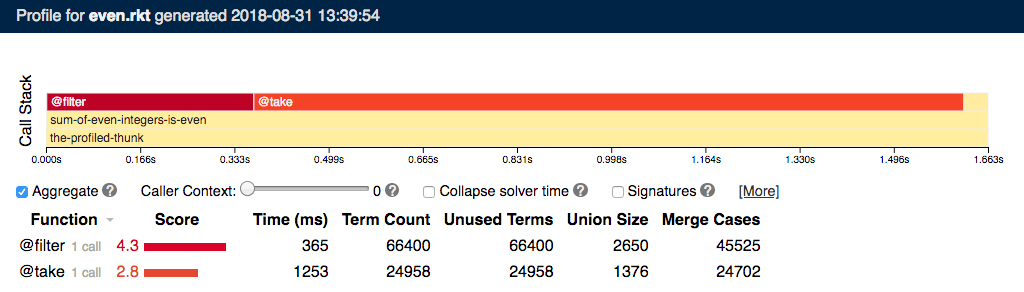
In this output, the “call stack” shows the calls the program makes (similar to a flamegraph), and the table below has one row per procedure in the program. The profiler gathers a variety of metrics and summarizes them as a single score, which ranks procedure according to how likely they are to be bottlenecks. Of course, there’s much more detail about how this analysis works in our OOPSLA paper.
Case studies and results
We’ve performed seven case studies to demonstrate that symbolic profiling is effective and identifies real bugs. One study was on Neutrons, a tool used to verify the software of a radiotherapy device at the UW Medical Center. Using the symbolic profiler, we identified and repaired a bottleneck, making the verifier 290× faster—it’s now practically instantaneous, improving the development cycle. Another study was on the Cosette tool for verifying SQL queries. A recent change to Cosette introduced non-termination issues in several benchmarks. The symbolic profiler identified the bottleneck and, after a simple three-line repair, problems that did not complete within one hour now finish in seconds. In both cases (and in others), the project maintainers accepted our repairs.
In addition to performing case studies ourselves, we conducted a small user study with Rosette programmers. We gave them previously unseen codebases with (known to us) performance issues, and asked them to find those issues. Though the study was small, we saw that users with access to symbolic profiling were able to identify performance issues that users with only regular profiling tools could not. Even better, our users said that symbolic profiling helped them to understand how symbolic evaluation works, and gave them insight into the structure of the unseen codebases. Since releasing the symbolic profiler as part of Rosette, we’ve had several more stories from users who have resolved real-world performance issues.
Wrapping up
Custom-built verifiers and synthesizers are a promising approach to building correct and reliable software. Specializing these tools to a particular problem domain makes them “closer” to the programmer—they return results that are more understandable and relevant—and has the nice side effect of making them far more scalable. But to make it practical for a programmer to specialize such tools, their behavior needs to be understandable. Symbolic profiling is an effort in that direction, making symbolic evaluation analyzable by programmers for the first time. We found that symbolic profiling helps users understand their automated tools and find performance issues that, when fixed, lead to orders of magnitude-sized speedups.
-
This program obviously isn’t the most efficient way to do this, nor does it handle the case where there are fewer than
keven elements, but it suffices for illustration. ↩