exploring enronvisual data mining of e-mail
|
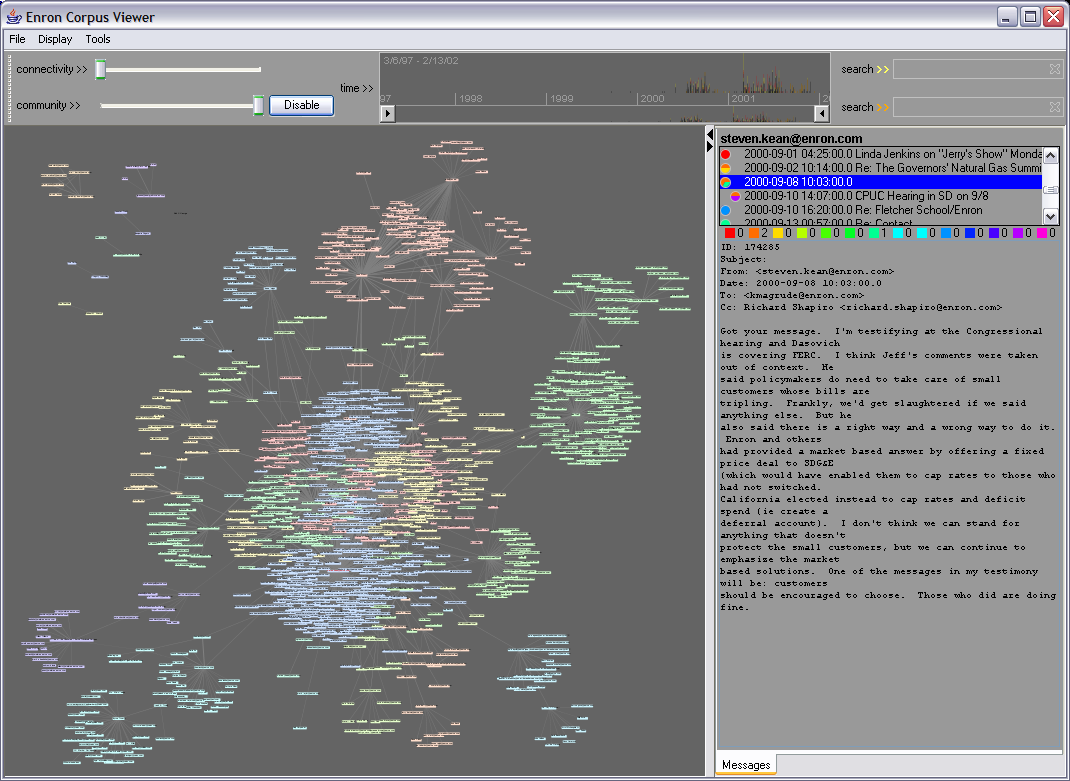
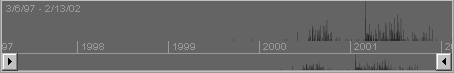
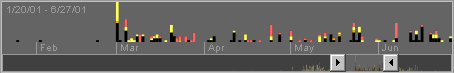
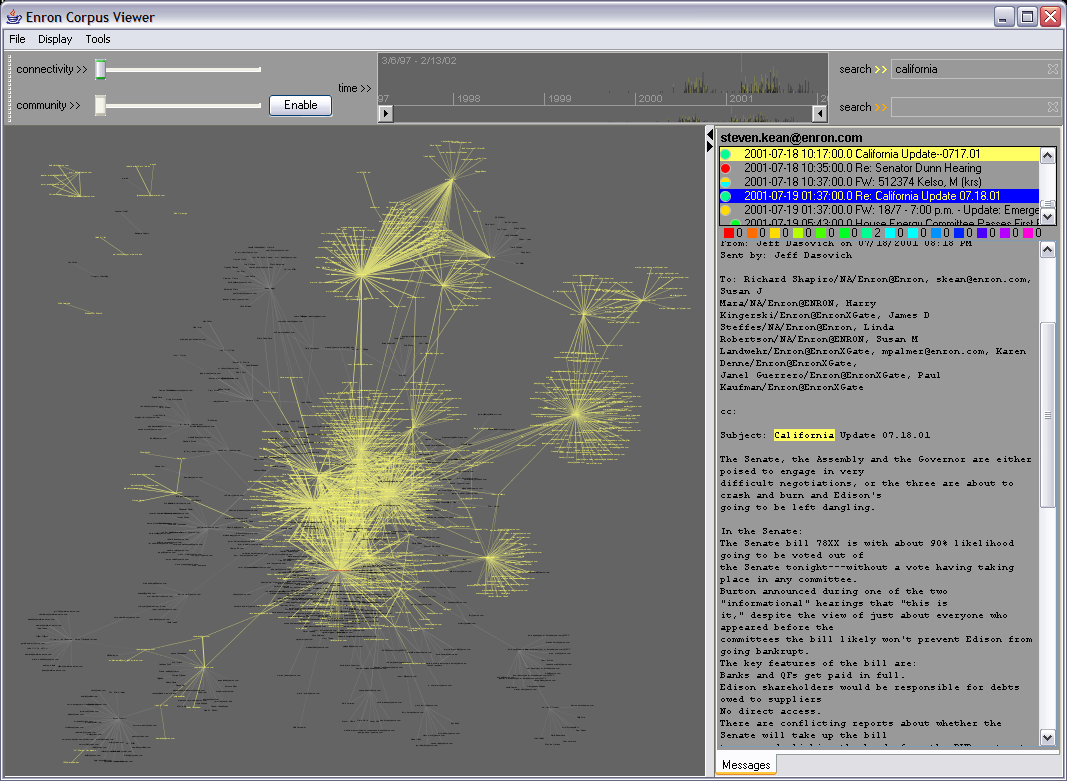
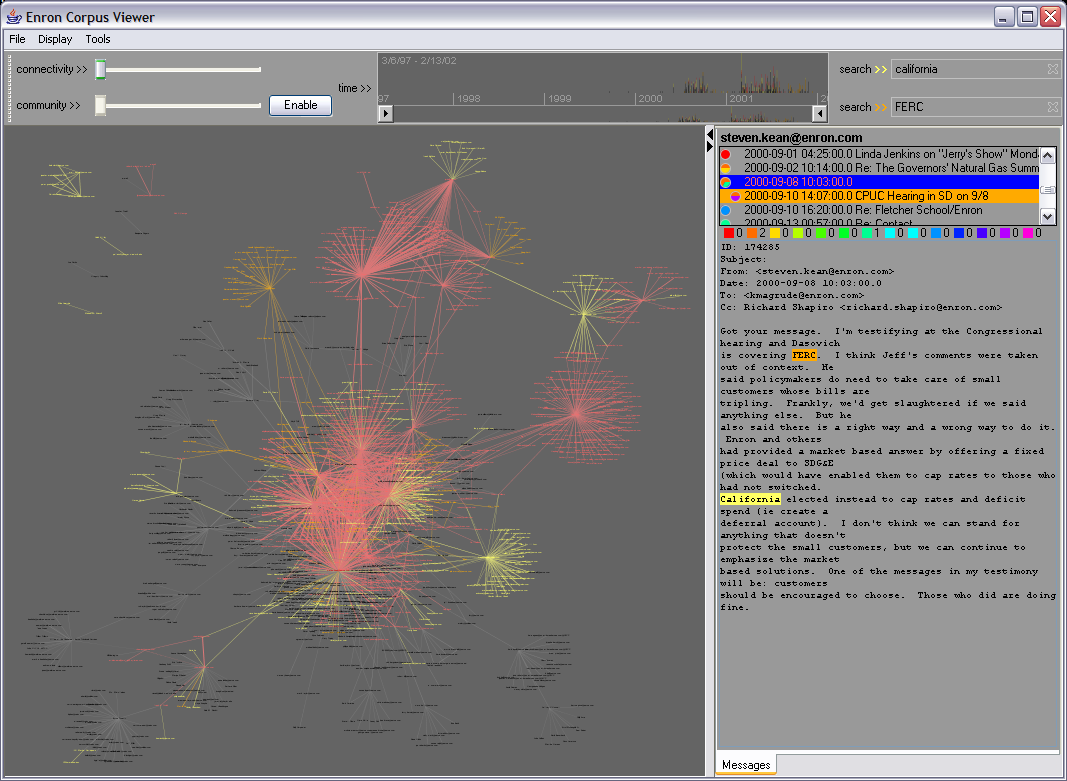
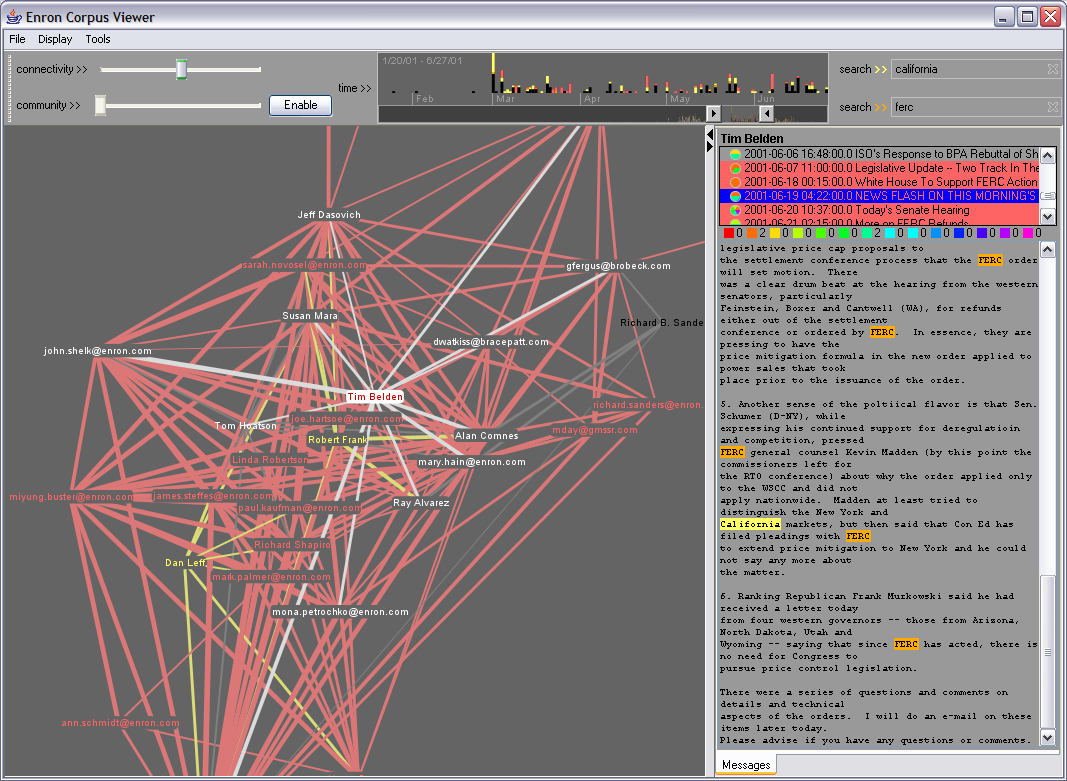
Version 2 of the enron corpus viewer (formerly known as "enronic") introduces a stablized layout, temporal filtering, and multiple keyword search. A multiscale histogram timeline displays the distribution of e-mails over time, and an interactive time axis and range slider allow for the selection of specific time ranges. The slider window can then be dragged across time to view network dynamics at the desired granularity. Keyword searches highlight matching nodes and edges. Independent searches can be run simultaneously. The current design uses additive colors (e.g. yellow + orange = red) to present intersecting search hits. Furthermore, search hits also highlight in both the time histogram and the message viewer. Finally, though it noticeably slows down the total rendering speed, this design experiments with anti-aliasing to make for more readable and pleasing displays. In particular, it allows for a much more sensitive reading of the categorization pie charts when in a fully zoomed-out state.