VegaProf
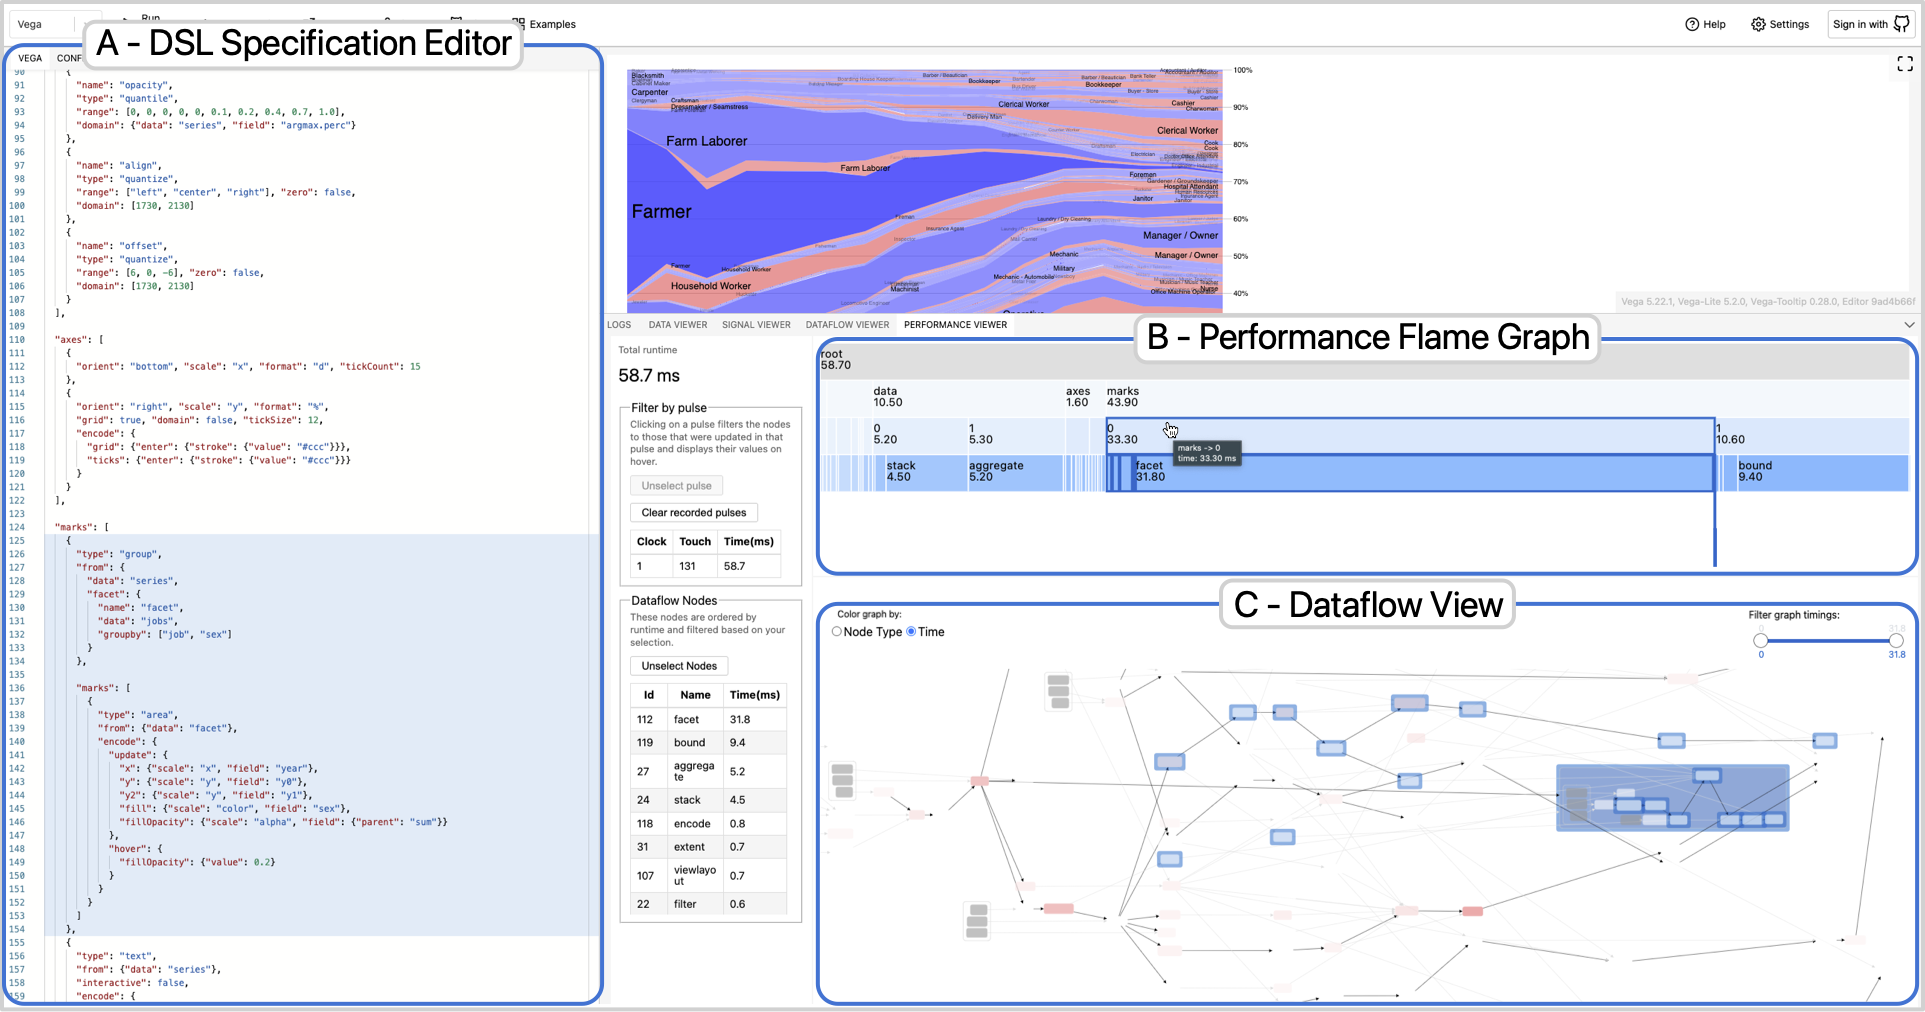
Vega is a popular domain-specific language (DSL) for visualization specification. At runtime, a Vega specification is transformed into a dataflow graph which is then executed to render visualization prim- itives. While Vega’s declarative design abstracts implementation details, it also makes Vega visualizations challenging to debug and profile. Our formative interviews showed that existing developer tools are not suited for visualization profiling as they are discon- nected from the semantics of the Vega specification and its interme- diate representations (IRs) at runtime. We introduce VegaProf, the first performance profiler for Vega visualizations. VegaProf instru- ments the Vega library by associating the declarative specification with its compilation and execution. Integrated into a Vega code playground, VegaProf enables coordinated visual performance in- spection at three abstraction levels: function, dataflow graph, and visualization specification. Our evaluation through three use cases and feedback from five visualization engineers and two original Vega developers shows that VegaProf makes visualization profiling tractable and actionable. Furthermore, we distill recommendations from our findings and advocate for developing visualization DSL with introspection tools in mind.